xrspatial.multispectral.nbr2#
- xrspatial.multispectral.nbr2(swir1_agg: xarray.core.dataarray.DataArray, swir2_agg: xarray.core.dataarray.DataArray, name='nbr2')[source]#
Computes Normalized Burn Ratio 2 “NBR2 modifies the Normalized Burn Ratio (NBR) to highlight water sensitivity in vegetation and may be useful in post-fire recovery studies.” 1
- Parameters
swir1_agg (xr.DataArray) – 2D array of near-infrared band data. shortwave infrared band (Sentinel 2: Band 11) (Landsat 4-7: Band 5) (Landsat 8: Band 6)
swir2_agg (xr.DataArray) – 2D array of shortwave infrared band data. (Landsat 4-7: Band 6) (Landsat 8: Band 7)
name (str default='nbr2') – Name of output DataArray.
- Returns
nbr2_agg – 2D array of nbr2 values. All other input attributes are preserved.
- Return type
xr.DataArray of same type as inputs.
Notes
Examples
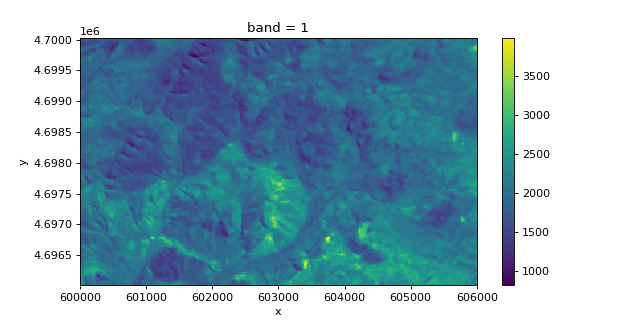
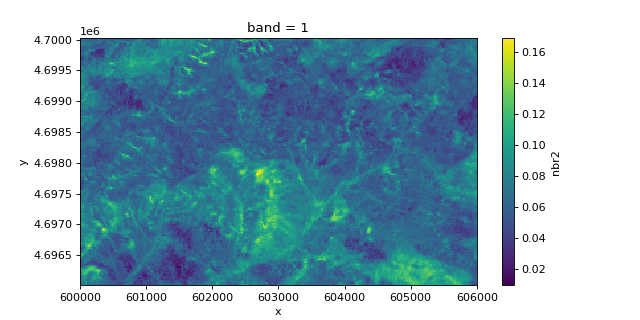
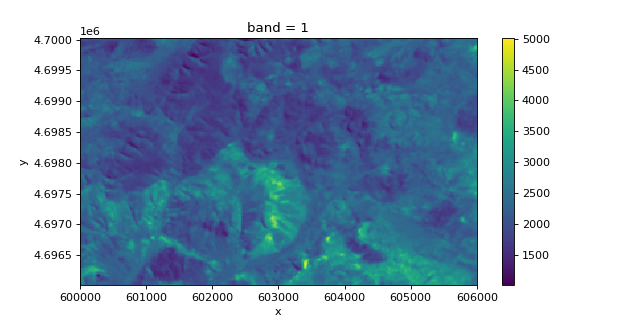
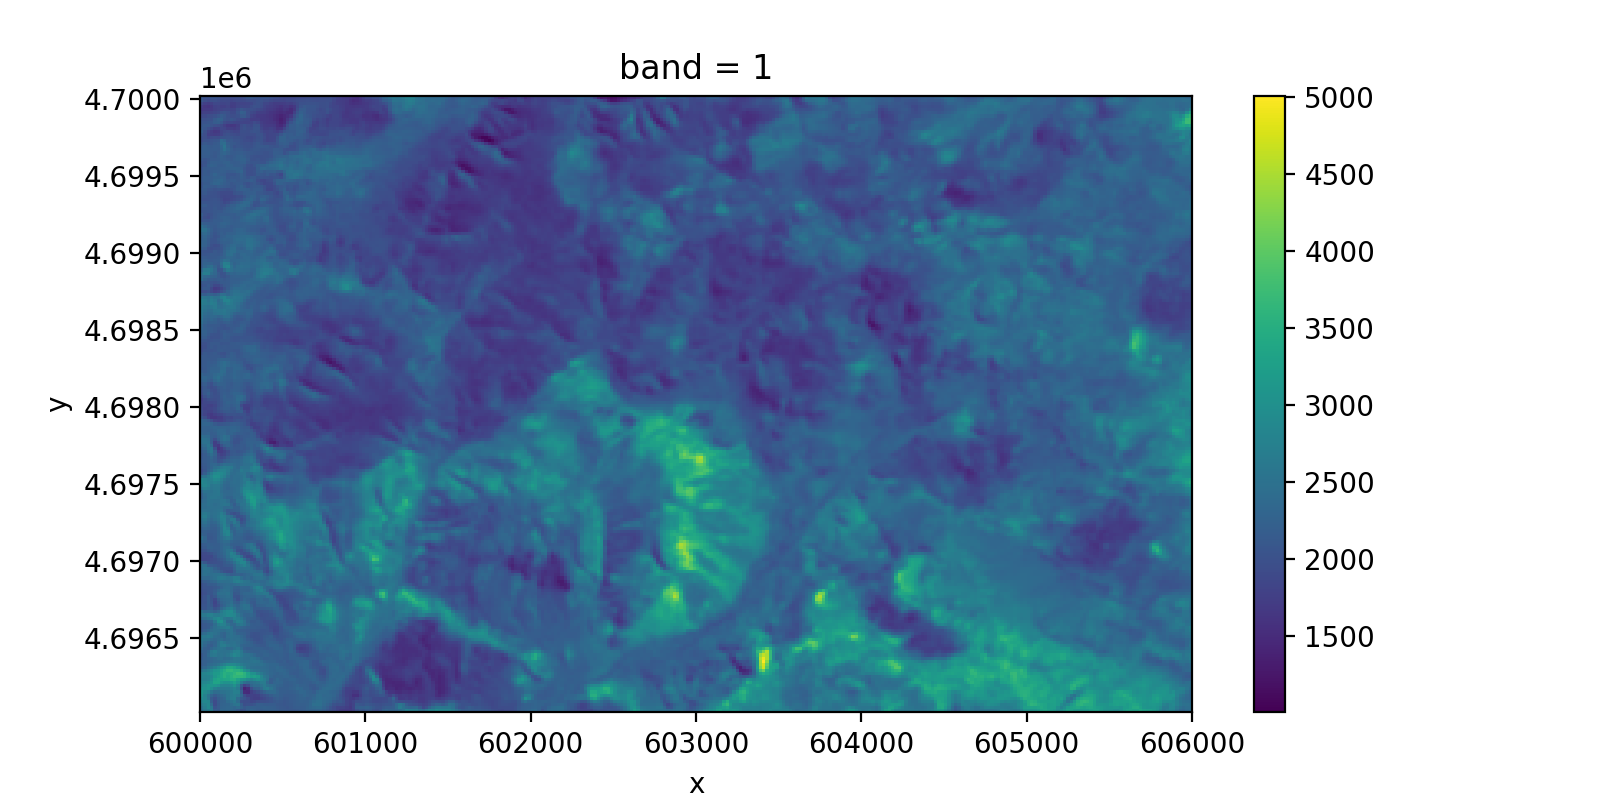
>>> from xrspatial.datasets import get_data
>>> data = get_data('sentinel-2')  # Open Example Data
>>> swir1 = data['SWIR1']
>>> swir2 = data['SWIR2']
>>> from xrspatial.multispectral import nbr2
>>> # Generate NBR2 Aggregate Array
>>> nbr2_agg = nbr2(swir1_agg=swir1, swir2_agg=swir2)
>>> swir1.plot(aspect=2, size=4)
>>> swir2.plot(aspect=2, size=4)
>>> nbr2_agg.plot(aspect=2, size=4)

>>> y1, x1, y2, x2 = 100, 100, 103, 104
>>> print(swir1[y1:y2, x1:x2].data)
[[2092. 2242. 2333. 2382.]
 [2017. 2150. 2303. 2344.]
 [2124. 2244. 2367. 2452.]]
>>> print(swir2[y1:y2, x1:x2].data)
[[1866. 1962. 2086. 2112.]
 [1811. 1900. 2012. 2041.]
 [1838. 1956. 2067. 2109.]]
>>> print(nbr2_agg[y1:y2, x1:x2].data)
[[0.05709954 0.06660324 0.055895   0.06008011]
 [0.053814   0.0617284  0.06743917 0.0690992 ]
 [0.07218576 0.06857143 0.067659   0.07520281]]